Personalize Audio Learning
New features and tools to increase your revenue with 'in-training' purchase opportunities to sell to your trainees or students online!
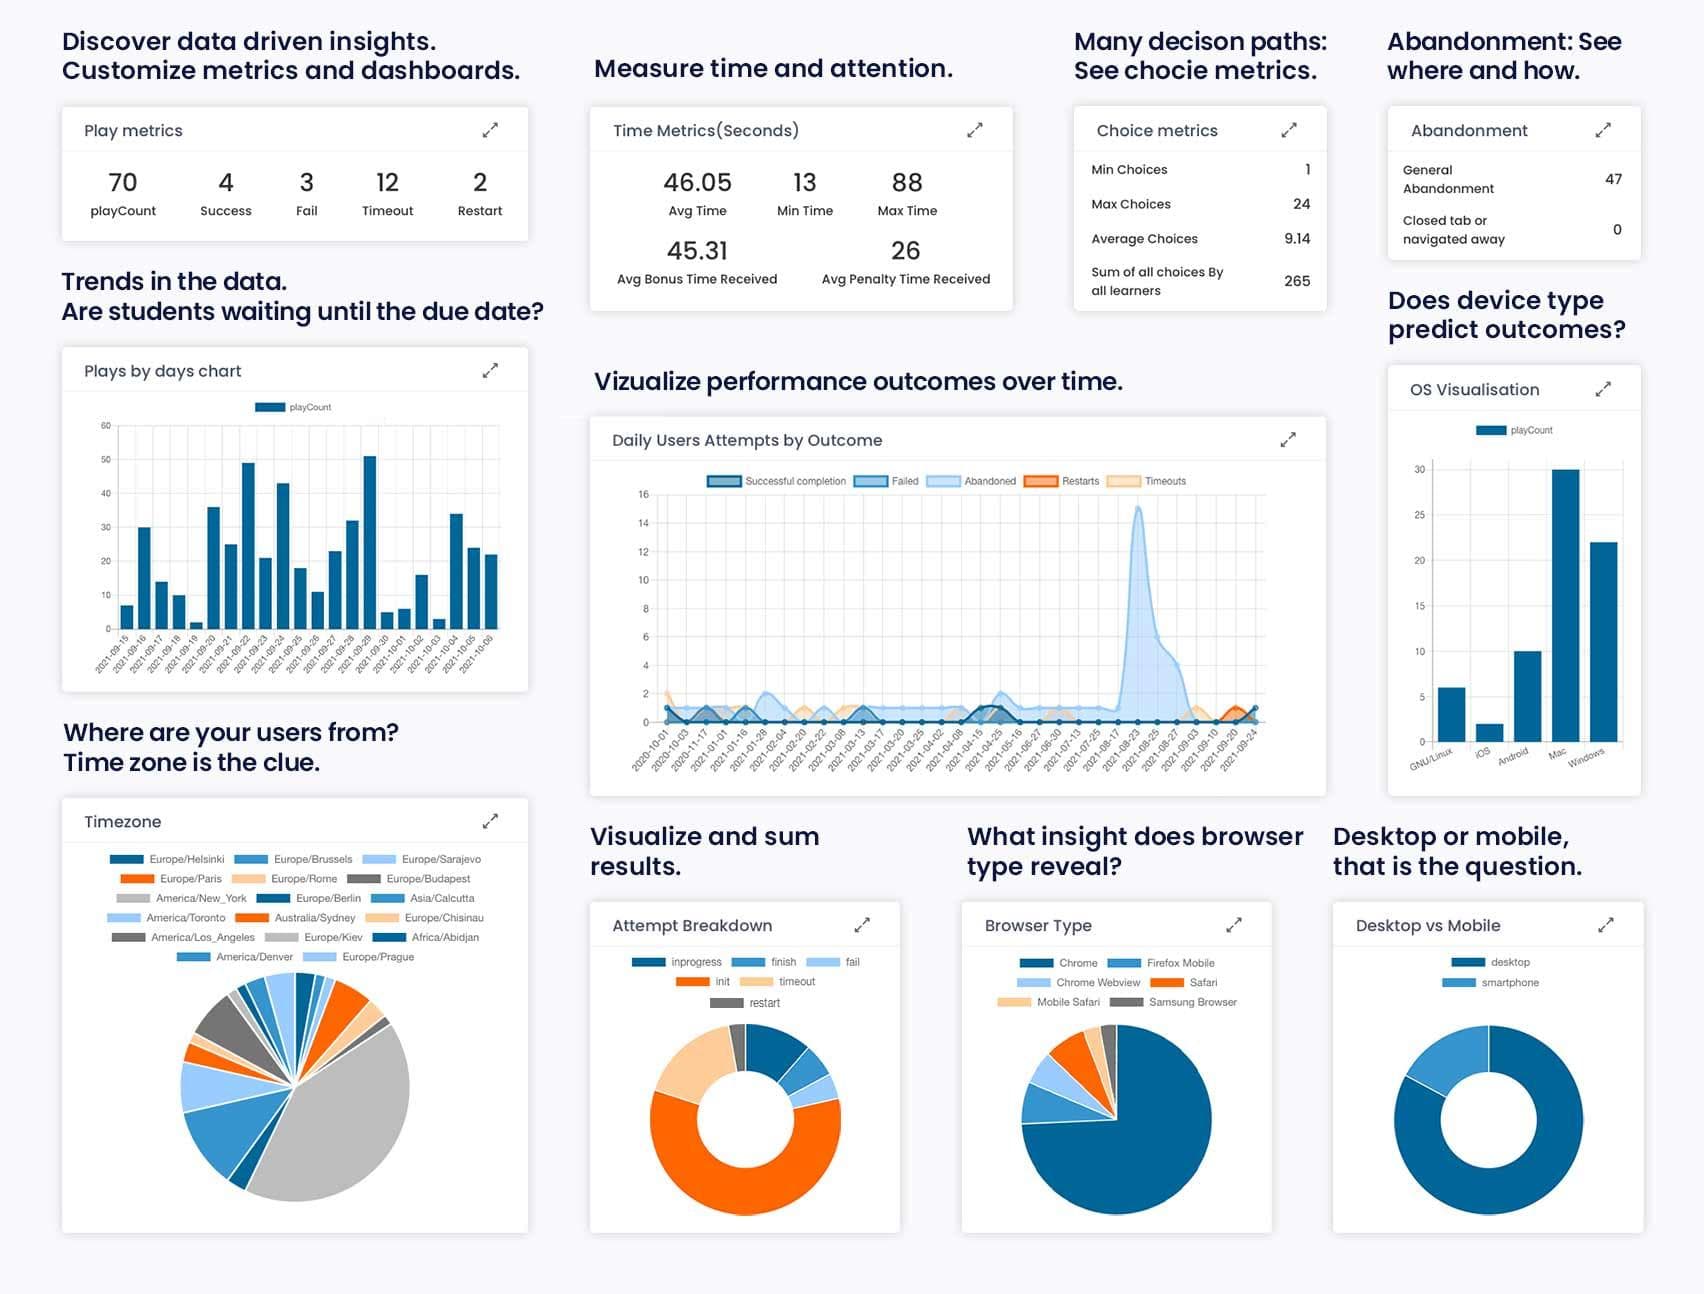
Transform survey data into actionable insights. Track learning gains, measure training effectiveness, and prove ROI with powerful pre/post comparison tools and real-time monitoring.
Real-time data refresh
Automatic data linking
Pre/post comparison
Measure exactly what changed. Compare identical questions from before and after your training, workshop, or intervention to demonstrate real impact.
Set up once, use forever. Create your comparison report in 3 simple steps.
Build two surveys with the same questions—one for before, one for after. Or use different questions and compare specific items.
Create a Compare Survey Report and select which questions to compare. The system handles the rest automatically.
As participants complete both surveys, results appear in your comparison dashboard instantly. Filter by date, group, or custom tags.
Stop wondering if your participants are completing surveys. The Live Training Monitor refreshes every 3 seconds, showing you real-time completion status during your training session.
Typical Training Flow:
Professional research tools that grow with your needs
System automatically links responses across multiple surveys using email or unique identifiers. No manual matching required.
Slice your data any way you need. Apply multiple filters to focus on specific participant groups or time periods.
Transform raw data into compelling visuals. Choose from multiple chart types to tell your story.
Get your data in the format you need. Export to industry-standard formats for further analysis.
Real scenarios from real users
Challenge: Master trainers needed to prove training effectiveness to funders
Solution: Pre/post surveys with automatic data linking, live monitoring during sessions
Result: 100% completion tracking, instant proof of knowledge gains, streamlined reporting for grants
Challenge: Graduate student needed to track participants across 3 survey timepoints
Solution: Automatic user merging linked all surveys by email, compare reports showed changes over time
Result: Perfect data pairing, publication-ready exports, saved 40 hours of manual data matching
Challenge: L&D team needed to demonstrate ROI of new compliance training
Solution: Pre/post comparison dashboard showing knowledge gains, exportable reports for leadership
Result: 35% average knowledge increase proven, training budget approved for next year
Challenge: Community organization needed to report program outcomes to funders
Solution: Survey comparison reports with visual charts, filtered by program site and date
Result: Professional evaluation reports, secured continued funding, expanded to 3 new sites
Pre/post comparison, live monitoring, automatic data linking, and professional exports are standard features. No enterprise pricing required.
Everything you need to know about survey analysis
Yes! You select which specific questions to compare. Questions don't have to be identical, though matching questions provide the clearest comparison.
The system matches participants using email addresses or unique IDs. When someone completes both pre and post surveys, their responses are automatically paired in the comparison dashboard.
Absolutely. Click any participant in the comparison view to see their complete pre/post responses side-by-side, with changes highlighted.
The comparison report shows completion status. You can filter to see only complete pairs or view partial completions. Incomplete pairs are flagged for follow-up.
Survey data is retained indefinitely on all paid plans. You can access and export historical data anytime.
Yes! Create as many comparison reports as you need. Each report can compare different survey pairs with custom question selections.
98% of Mazetec users launch their first simulation within a week.
Try for FreeWe're always researching new ways to to boost Mazetec's evidence-based platform, grounded in theories from Education, Psychology, and Computer Science and built on state-of-the-art technology designed to compliment and integrate with your existing learning ecosystem.

New features and tools to increase your revenue with 'in-training' purchase opportunities to sell to your trainees or students online!
New features and tools to increase your revenue with 'in-training' purchase opportunities to sell to your trainees or students online!

Upsell digital certificates to Unlock New Revenue Streams

Harness the Power of AI to Create Immersive, Interactive Learning Experiences